The choice of the most appropriate unsupervised machine-learning method for “heterogeneous” or “mixed” data, i.e. with both continuous and categorical variables, can be challenging. Our aim was to examine the performance of various clustering strategies for mixed data using both simulated and real-life data. We conducted a benchmark analysis of “ready-to-use” tools in R comparing 4 model-based (Kamila algorithm, Latent Class Analysis, Latent Class Model [LCM] and Clustering by Mixture Modeling) and 5 distance/dissimilarity-based (Gower distance or Unsupervised Extra Trees dissimilarity followed by hierarchical clustering or Partitioning Around Medoids, K-prototypes) clustering methods. Clustering performances were assessed by Adjusted Rand Index (ARI) on 1000 generated virtual populations consisting of mixed variables using 7 scenarios with varying population sizes, number of clusters, number of continuous and categorical variables, proportions of relevant (non-noisy) variables and degree of variable relevance (low, mild, high). Clustering methods were then applied on the EPHESUS randomized clinical trial data (a heart failure trial evaluating the effect of eplerenone) allowing to illustrate the differences between different clustering techniques. The simulations revealed the dominance of K-prototypes, Kamila and LCM models over all other methods. Overall, methods using dissimilarity matrices in classical algorithms such as Partitioning Around Medoids and Hierarchical Clustering had a lower ARI compared to model-based methods in all scenarios. When applying clustering methods to a real-life clinical dataset, LCM showed promising results with regard to differences in (1) clinical profiles across clusters, (2) prognostic performance (highest C-index) and (3) identification of patient subgroups with substantial treatment benefit. The present findings suggest key differences in clustering performance between the tested algorithms (limited to tools readily available in R). In most of the tested scenarios, model-based methods (in particular the Kamila and LCM packages) and K-prototypes typically performed best in the setting of heterogeneous data.
Cluster analysis aims to partition unlabeled data into homogeneous groups, such that two instances are similar if they belong to the same cluster, and dissimilar otherwise. Although this unsupervised machine-learning task is often considered in the context of either continuous or categorical datasets, this task remains challenging when dealing with “heterogeneous” or “mixed” data, i.e. with both types of variables. As previously emphasized, clustering of mixed data is challenging because it is difficult to directly apply mathematical operations to both types of feature variables 1 . One of the main issues arising in the framework of mixed data clustering is thus the choice of the most appropriate distance or model to simultaneously process both data types. Indeed, clinical research usually relies on heterogeneous data: clinical datasets typically include a mix of variables related to clinical history (usually categorical variables), general/anthropometric data (usually continuous variables such as age and body mass index), physical examination (both categorical and ordinal variables) and laboratory or imaging findings (often continuous variables). Note that among laboratory variables, omics data are increasingly available today. Such heterogeneity urges for ways to guide users and clinical practitioners in choosing appropriate clustering approaches for heterogeneous clinical datasets in order to achieve efficient phenomapping of patients in various clinical settings.
Discretization and dummy-coding are some of the simple and intuitive solutions to obtain a homogeneous dataset containing only categorical data on which classical techniques can be applied. However, this approach may introduce distortion in the original data and may consequently lead to increased bias 2 . Fortunately, a wide range of clustering algorithms has been specifically developed to deal with mixed data. A detailed taxonomy of available methods has been reported recently by Ahmad and Khan 1 . Nevertheless, the end-user may be bewildered when choosing one of these techniques as there is no clear guidance for choosing the most appropriate technique in a given context. To our knowledge, few benchmark studies have examined the performance of clustering strategies for mixed type variables on both real and simulated data 3 . Moreover, only a few of the available techniques have been tested in previous benchmark attempts. In addition, an external assessment of available techniques, by a group not directly involved in their development, may further strengthen the generalizability of the results. In fact, a better understanding of the strengths and weaknesses of each clustering strategy may help to clarify the lack of reproducibility and generalization sometimes observed in the setting of mixed data clustering.
The present study aims to assess the performance of clustering strategies for mixed data in both simulated and real case scenarios. In the first group of scenarios, virtual populations with available mixed variables were generated on which a benchmark of clustering techniques was conducted. The same techniques were subsequently applied to a real-life dataset from the EPHESUS randomized clinical trial 4 to illustrate the importance of choosing the appropriate clustering technique. As our focus was to test tools readily/easily available to clinical researchers, we therefore restricted our analysis to “off-the-shelf” tools readily available from the R software (R Core Team), that cover only a portion of all available methods for clustering heterogeneous data.
From a formal point of view, three design questions must be addressed in the specific setting of mixed data clustering. The first question (Q1) is how to calculate similarities/distances for categorical and numeric data when using distance-based algorithms, or how to transform the data for model-based methods. The second question (Q2) is related to the methodology to merge numerical and categorical parts. The last question (Q3) is the choice of the algorithm that will be used to build optimal clusters.
As mentioned above, to facilitate the evaluation process, we selected only clustering algorithms either already present or easily implementable in the R software (R version 3.6.3, R Core Team). Thus, and due to computing time load and lack of availability of some of them, only a limited number of representative techniques were retained for this study. The selected algorithms are described in Table 1 according to the three design questions relevant for heterogeneous data. Algorithms are grouped as distance-based or model-based. In the first group, the dissimilarities (Q1) used by the various algorithms are different between numeric and categorical data except for the UET distance (see below "Unsupervised extra trees dissimilarity (UET)" section). Merging (Q2) is therefore not required with UET distance. Two optimization algorithms (Q3): K-medoids or hierarchical ascendant clustering (HAC) using Ward aggregation measure (see below "Partitioning around medoids (PAM)" and "Ascendant hierarchical clustering (HC)" sections respectively) have been used with Gower and UET dissimilarity matrices, whereas the K-prototypes (see "K-prototypes (kproto)" section) uses K-means. For most model-based methods, the distributions of both numeric and categorical variables are transformed (Q1) into probabilities, except for Kamila which uses Euclidean distance to handle numeric variables and probabilities for categorical ones (see "Kamila" section). Therefore, Kamila needs to set up an ensemble-like approach to merge (Q2) both types of data, using both K-means and Expectation Maximization (EM) as optimization algorithms (Q3). The three other model-based methods do not need any merging procedure as both types of variables are included in a unique probabilistic model and use EM algorithms with specific variants (see below "Clustering by mixture modeling (Mixmod)" to "Latent class analysis (LCA)" sections).
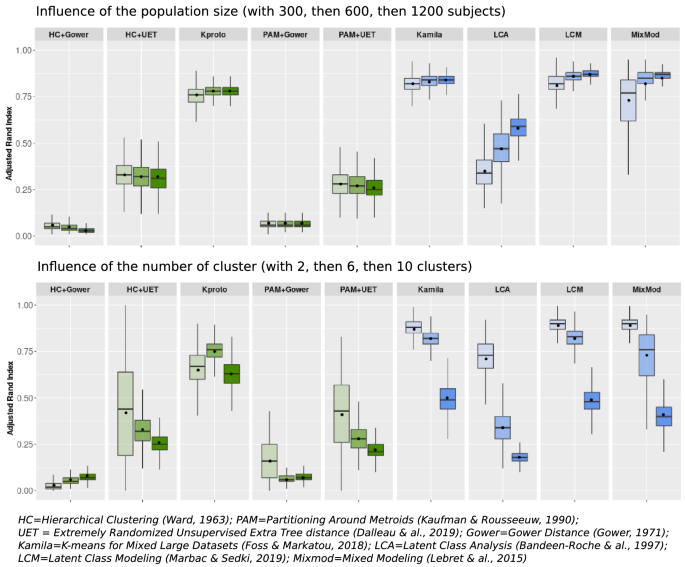
An increase in the number of subjects (Fig. 1, left panel) appeared to only positively impact LCA and Mixmod, two model-based methods. Meanwhile, Kamila, Kproto and LCM exhibited a constant good performance irrespective of population size, surpassing the ARIs achieved with other methods.
When increasing the number of clusters up to 10 (Fig. 1, right panel), the mean ARIs dropped for all methods. K-prototypes outperformed all other techniques when the number of clusters was maximum (10 in the present instance). LCM and Kamila displayed the shortest boxplot size, indicating the most reliable results over replications.
For both population size and number of clusters scenarios, the model-based methods and K-prototypes attained higher ARIs than other distance-based methods. Specifically, the Gower distance yielded the worst results when combined with either HC or PAM methods.
Figure 2 shows the influence of the characteristics of the variables on clustering performance.
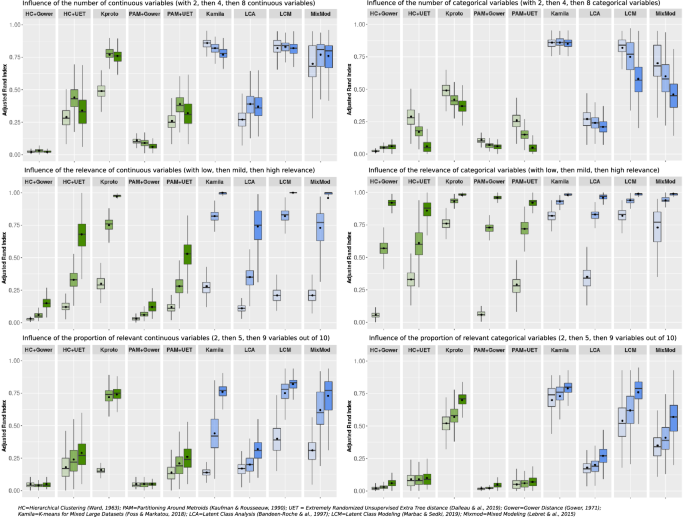
When increasing the number of continuous variables with a constant number of categorical variables [ratio numeric versus categorical 1:2, 1:1 and 2:1)], the ARI of K-prototypes increased, while the ARIs of Kamila, LCM and Mixmod were constantly high. In contrast, when the proportion of categorical variables increased symmetrically, the ARIs of all methods decreased except for Kamila, which maintained a low variance and a satisfactory mean ARI in all cases.
The impact of the respective relevance of continuous and categorical variables is illustrated in the middle panels in Fig. 2. As expected, the mean ARIs increased with the relevance of the variables. Indeed, clustering becomes an easier task when all variables are more relevant.
The impact of varying the proportion of relevant variables (2/10, 5/10 and 9/10), is illustrated in the bottom panels of Fig. 2. Kamila, LCM, Mixmod and K-prototypes exhibited rising ARIs with the reduction in noise.
We used statistical tests to compare ARIs within distance-based methods, within model-based methods and between models-based and distance-based methods. All of these numerous comparisons (96 tests) retrieved p values < 0.0001 (Supplementary Table 1).
Importantly, runtimes differed across methods as reported in Supplementary Table 2 for scenarios 1 and 2. Yet none of them exceeded 20 s.
In summary, distance-based methods (except the K-prototypes) displayed low ARIs in this simulation framework. The lowest ARIs were observed for Gower’s distance either with PAM or hierarchical clustering. In contrast, Kamila and LCM displayed the highest and most stable ARI overall in the vast majority of the scenarios presented herein.
The results obtained with distance-based and model-based clustering methods on the EPHESUS dataset are respectively presented in Figs. 3 and 4.
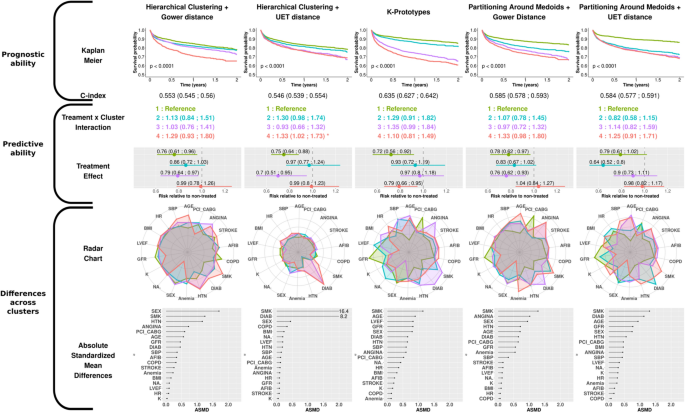
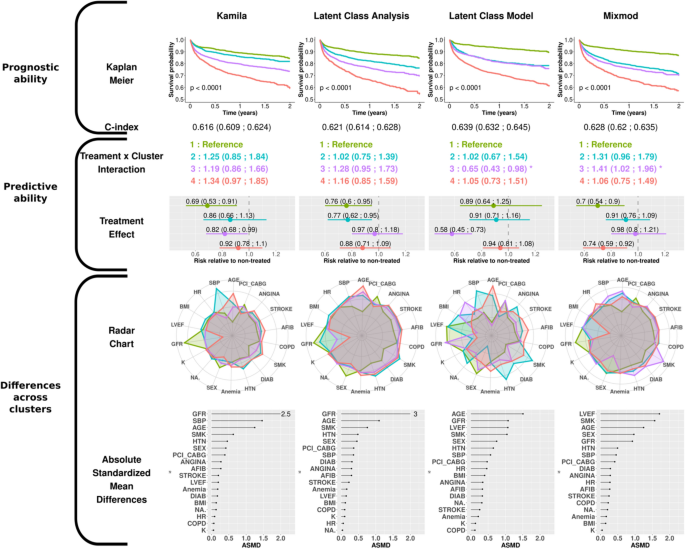
The clusters are numbered from 1 to 4 according to the ascendant overall risk as estimated by the Kaplan–Meier curve. Thus, regardless of the method used, group 1 (green) had the lowest risk of hospitalization or death related to heart failure, while group 4 (red) had the highest risk.
When considering the survival rate of the subjects via the Kaplan–Meier curves, the K-prototypes method was the only distance-based method that distinguished four groups with noteworthy survival differences together with a C-index > 0.60. For model-based methods, LCA distinguished four well-separated survival patterns, which confirmed the findings of Ferreira et al. 16 . Meanwhile, the LCM algorithm, which had the highest C-index of all methods, identified only 3 distinct survival patterns (the 2nd and 3rd clusters virtually displaying identical survival over time).
To quantify the treatment effect across clusters, Cox models were constructed with treatment, cluster and respective interaction as covariates. For distance-based approaches, only group n°4 in HC + UET experienced less treatment benefit relative to group 1 (reference ; 0.99 [0.80;1.20] versus 0.75 [0.64;0.88]) (Second row, Fig. 3).
In the model-based results, significant interactions were identified with LCM and Mixmod. The 3rd cluster identified in LCM had the highest risk reduction observed in our analysis (0.58 [0.45; 0.73]) (second row, Fig. 4), whereas the 3rd cluster identified with MixMod showed less treatment benefit than the reference (0.98 [0.8:1.21]).
The radar charts and dot charts depicted in Figs. 3 and 4 highlight the between-cluster differences in the variables used in the algorithms.
For all methods, both gender and smoking status appeared in the top 5 ASMD (Absolute Standardized Mean Differences). The K-prototypes and the PAM + UET methods yielded the most distinct radar shapes among distance-based clustering methods. Interestingly, the partition provided by the HC + UET was highly driven by two well-known risk factors: smoking status and history of diabetes (ASMD of 16.4 and 8.2 respectively). The groups exhibiting the highest proportion of these factors were also those most at risk, given the overall survival probability. Considering the model-based method, only the Latent Class Model method had very distinct cluster profiles on the radar chart. Age, glomerular filtration rate (GFR) and smoking status were in the top 5 highest ASMD for all model-based methods.
Overall, on the EPHESUS trial data, the K-prototypes and the LCM methods identified clusters with notable differences in characteristics and prognosis although only the LCM method identified a subgroup with substantial treatment effect.
The present findings highlight substantial differences in clustering performance (as measured by ARI on simulated data) between the various methods tested; these methods cannot consequently be considered as interchangeable in the setting of heterogeneous data. Overall, our simulations demonstrate the dominance of K-prototypes, Kamila and LCM over all other methods. In addition, the classical methods using dissimilarity matrices such as Partitioning Around Medoids and Hierarchical Clustering generally performed poorly in comparison with model-based methods. Furthermore, when applying the clustering methods to a real-life clinical dataset, LCM yielded the most promising results, in that it (1) featured the most striking differences in clinical profiles across clusters, (2) exhibited the best prognostic performance of all clustering methods (highest C-index) and (3) identified a subgroup of patients with substantial treatment effect (HR < 0.6).
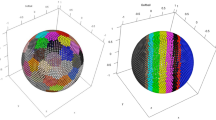
Complex situations in cluster analysis have already been emphasized (e.g. in the scikit-learn documentation, https://scikit-learn.org/stable/modules/clustering.html). Yet, in our analysis, as shown in Supplementary Fig. 2, the clusters are relatively well defined, and have “classical” shapes as illustrated by the t-SNE analysis. This suggests that the complexity/difficulty of the clustering is emerging from the heterogeneity of the data rather than the “shape” of the clusters.
The satisfactory performance of LCM and Kamila was partly expected since the simulated data matched their assumptions (better grasp of data heterogeneity). However, Kamila appeared to better tackle the high imbalance between continuous and categorical data than any other method.
Although Mixmod featured a good mean ARI, its great variability (as assessed by the width of the box plots) calls into question the reliability of this algorithm in a given experiment. This level of performance variability may be explained by the choice of the mixture model, which was the least constrained of the 40 available models. Indeed, it allowed different cluster sizes, volumes, shapes, as well as different parameter sets according to cluster, variable and levels. Given all the parameters to be estimated, the number of runs (only one by default) and iterations (200 by default) may not have been sufficient to reach the global minima. Nevertheless, increasing the number of runs and iterations would have led to an impractical computation time, in this context of simulations.
The K-prototypes technique is an interesting case, being the only efficient distance-based method in this benchmark. Although conceptually similar to PAM, its weighted combination of distances may be the key to its success. However, its performance may be greatly diminished on unfavorable datasets with continuous variables of low relevance, (as illustrated in Fig. 2).
The under-performance of LCA may be due to the choice of the cut-points to discretize the continuous variables 21 . Indeed, the cut-point was determined automatically such that three balanced classes arose from each continuous variable, which is not likely to reflect the underlying partition. Nevertheless, this approach represents the routine use of LCA, which is a popular clustering approach.
With the present results in mind, the following points could help researchers in choosing adequate clustering methods in the setting of heterogeneous data.
The present analysis aimed to provide some guidance in the choice of a clustering method for heterogeneous data. Given the growing access to multiple data sources, it has become crucial to be able to manage all types of variables through recent advances in statistics and machine-learning. While a few clustering tools for mixed data have been investigated in the present analysis, many more have been developed for this purpose. Nonetheless, this abundance of techniques may confuse end users, since they generally ignore the performance of these techniques relative to each other. As noted by Ahmad and Khan 1 , this mainly stems from the fact that the methods are often evaluated on a restricted number of datasets which cannot be extrapolated to every usage. For example, the popular “Heart-Cleveland” dataset has an arbitrary target variable, while the “Australian Credit” dataset has only a binary target. The generated simulated datasets herein were hence based on a combination of the Qiu and Joe’s 17 method and a simple home-made stratified sampling.
The benchmark itself, although conducted over a limited selection of methods, revealed a huge performance gap observed between “popular” algorithms (such as Hierarchical Clustering and PAM) and more sophisticated methods (such as Kamila or LCM) in all tested scenarios. However, this does not imply that the former will never be useful, or that the latter will always perform better. For instance, in a setting where groups are nested circles, Kamila will fail to identify the clusters, whereas a hierarchical algorithm with a single linkage aggregation method will easily complete the task.
Even if a clustering technique yields excellent results, its potential is nonetheless ineffective if such technique cannot be implemented in current popular software packages. Indeed, efficiently translating an algorithm into a program is an arduous task for most users of such tools. Of even greater importance is that the quality of the implementation directly determines the computation time. Despite the increased performance of current computers, the clustering time can rapidly become overwhelming, especially when multiple runs are required to determine the number of clusters, or in selecting variables such as in the LCM algorithm. This aspect should not be underestimated as the datasets can quickly reach huge proportions in a big-data context. As already stated above, the Kamila algorithm is particularly well suited for a big-data setting.
According to Hennig 22 , multiple relevant partitions can be found in a population, just as a deck of cards can be clustered according to colors, shapes, values or faces. Consequently, cluster analysis can be considered as successful only if the partition makes sense for the practitioner. Therefore, the involvement of field specialists in the clustering process is essential to determine the question of interest as well as a suitable knowledge of the relevant variables or the number of clusters. Despite the immense progress enabled by artificial intelligence in recent years, human experience and intuition remain the best judge in cluster analysis. That being said, it is very likely that useful clinical information will arise only from clustering algorithms displaying good intrinsic performance. In keeping with the latter, the results of the present benchmark analysis could strengthen the collaboration of data-analysts, clinical researchers and physicians by using the most appropriate machine-learning tools. Importantly, our results provide guidance on how to use all available (heterogeneous) clinical, biological and imaging data for clustering analysis in clinical research cohorts. UET as a stochastic–based method for computing pairwise distances while avoiding the burden of data preparation is particularly relevant both for large heterogeneous datasets (with thousands of variables) and structures 6 . Conversely, its underperformance could be related to the simulated datasets using normal distributions for continuous variables, which are a better fit with model-based methods. Nonetheless, a number of continuous variables often follow a normal distribution in clinical research.
Although the genRandomClust function allows unbalanced cluster sizes and outliers, these features were not used herein due to lack of time. The impact of these characteristics would be worth investigating in subsequent studies. In addition, scenarios with non-normal continuous variables may yield different results and should be tested in subsequent studies. However, our simulation study already covers a number of scenarios which could already be useful in a range of clinical studies.
An important limitation of our work is the use of the Hamming distance for the categorical data in the distance-based algorithm implemented in R software (as shown in Table 1). The use of other approaches could have resulted in largely different clustering performance. More advanced approaches, such as the novel clustering algorithm developed by Hautamaki et al. 23 , based on local search for its objective function using entropy, could provide clustering quality comparable to the ones obtained with model-based approaches in our analysis. However, to our knowledge, such algorithms are not yet incorporated in “ready-to-use” dedicated software packages, easily usable by non-expert teams.
The results from the present simulation study focused on ”ready-to-use” tools from R and suggest that model-based tools (p.e. the Kamila and LCM packages implemented in R) usually perform better than distance-based tools (except K-prototypes packages implemented in R) in the setting of heterogeneous data such as clinical research datasets including both numeric and categorical variables. The present results suggest that model-based tools that are currently readily available to biology and clinical researchers can be useful practical solutions for performing clustering in situations involving heterogeneous data. Future work should continue this effort for benchmarking "ready-to-use" clustering tools on mixed data, possibly using our simulated datasets (available on http://mbi.loria.fr/clustering-of-mixed-data/). Eventually, benchmarking platforms of mixed data should arise, which would make it possible to test new tools in the future and compare them with previously benchmarked tools. We believe this effort is necessary as only the use of the most relevant approaches could improve our ability to identify clinically relevant subgroups in numerous clinical settings, by feeding efficient clustering algorithms with both clinical and biological data.
This work and the publication of this article were funded by the Agence Nationale de la Recherche (grant number ANR-15-RHUS-0004: RHU FIGHT-HF) and by the CPER IT2MP (Contrat Plan État Région, Innovations Technologiques, Modélisation & Médecine Personnalisée) and FEDER (Fonds Européen de Développement Régional). Kevin Dalleau was recipient of a RHU-Region Lorraine doctoral fellowship.